I love Scratch, and Python. They are so slow, yet they are so fast to develop with… When I started experimenting with c++, it was weeks before I even saw my fractal on the screen. (then it was calculated about 4,000 times as quickly as these images were)
The scratch Mandelbrot generator series isn’t meant to be fast. It is ideal – It will have all of my favorite features. It will allow me to test new mathematical concepts easily (more of this later). It may be a place to draft these ideas before I implement them in Java or something.
I started by improving the colors in Mandelbrot 2. This was a huge task, because I acted on the misconception that the full color wheel of the pen was only available in scratch projects created after a certain date – so I re-created the entire program in another project.
I later disproved this theory about the pen, and I can’t really come up with a new one. it breaks pretty easily if I change the color with a numeric value before a using a color constant, or within too short a time after starting the project, and in other odd situations.
https://scratch.mit.edu/projects/126896952/
I focused mostly on improving efficiency and readability – I got rid of the global “running” variable, and made it possible to stop and start the program without restarting generation progress.

But all of this is moving towards an ultimate goal of inventing new ways of visualizing and measuring the Mandelbrot set and other Julia sets. I’ve dreamed of creating a set without edges of any kind. and not just by blurring the lines like Xaos does… I want a set that’s not quantized at all.
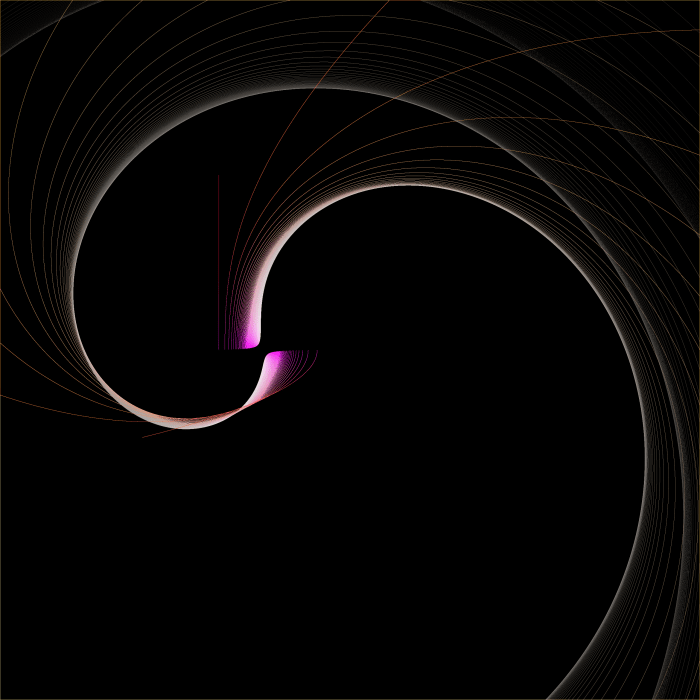
and angular coloring seems like a good place to start. You can see this is the header image at the top of my site, which I generated with Xaos.
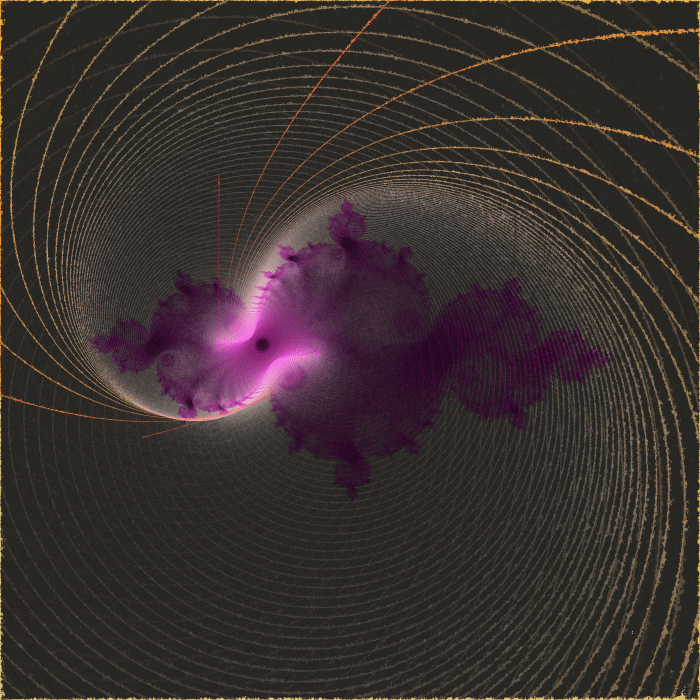
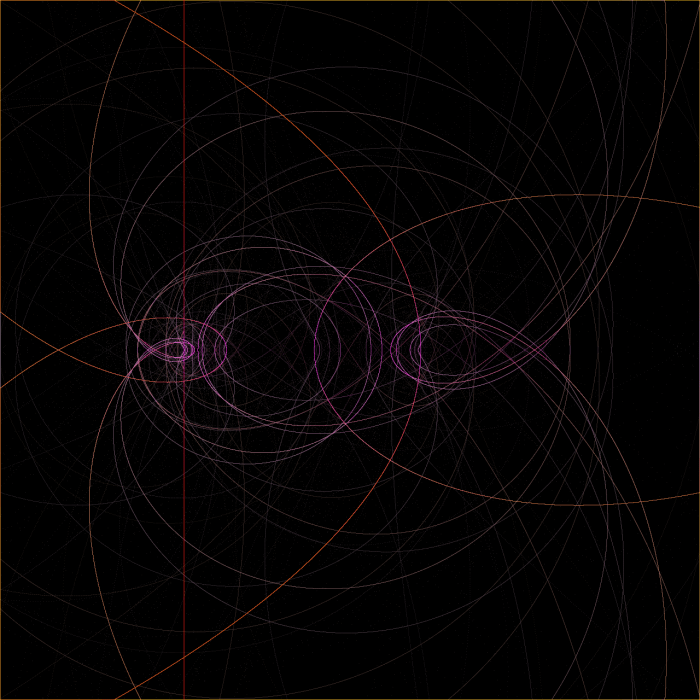
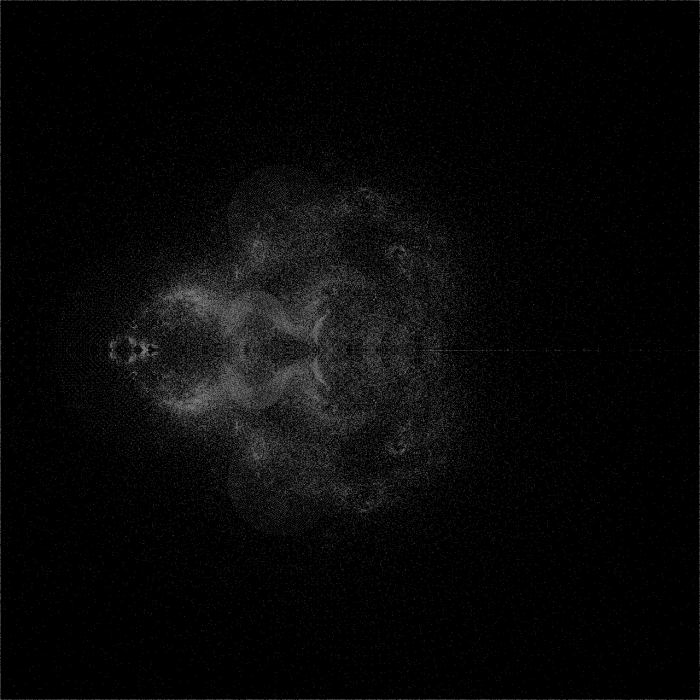
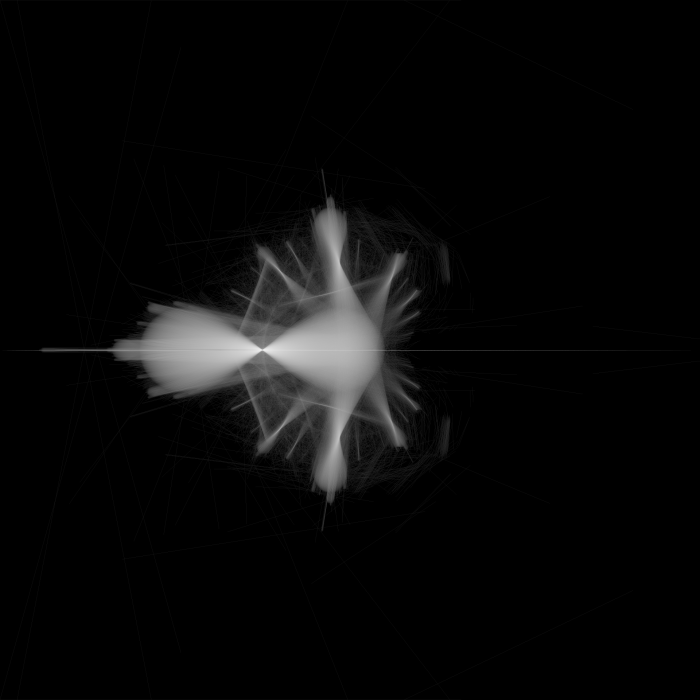
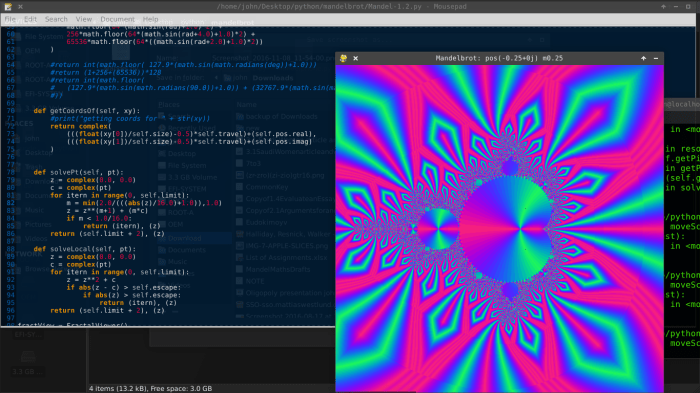
Here’s me using atan(zi/zr) and atan((zi-zio)/(zr-zro)) as the color:
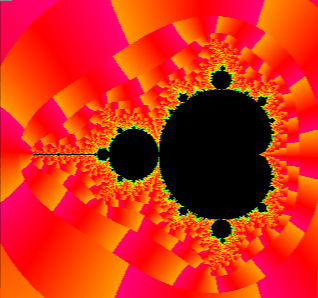
The second image has the angular result multiplied by 0.2, and added together with the iteration count. This gives the glow around the edges of the set.
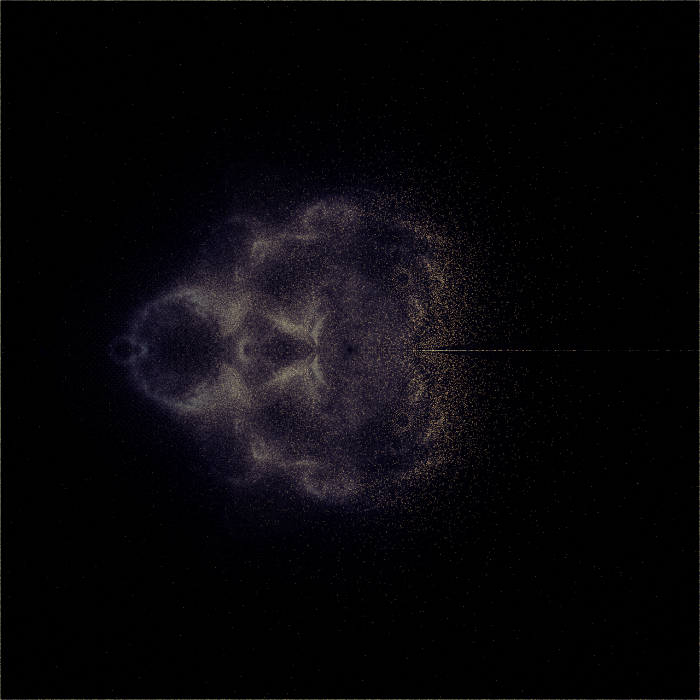
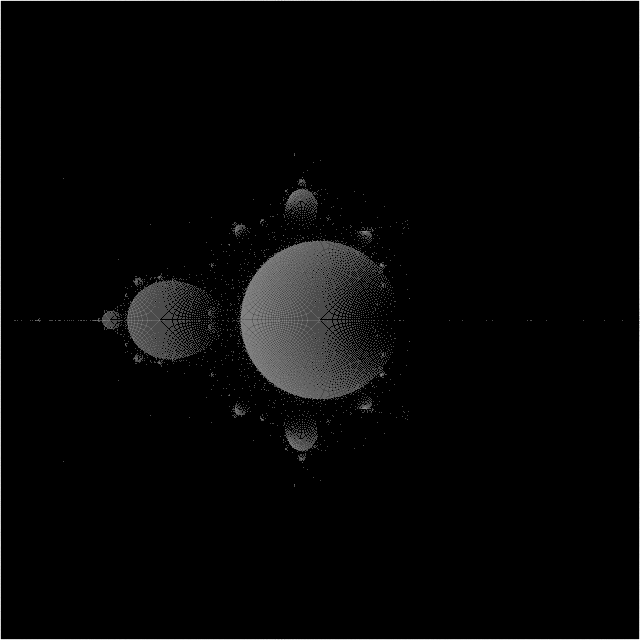
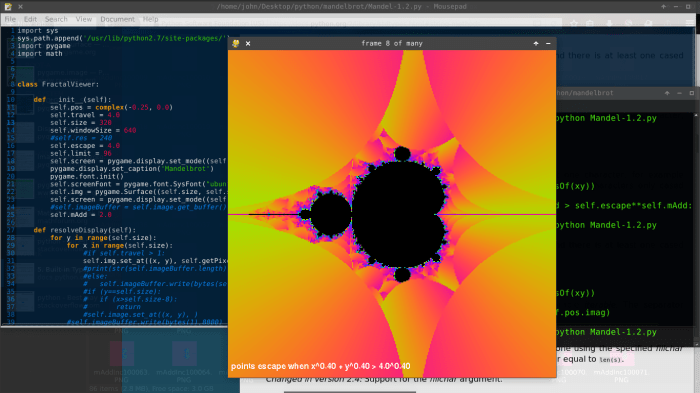
Here’s when I simply use zi as the color:

The yellow escapes above the real axis, the purple escapes below the real axis.
All of this has been done before. In fact, Xaos combines it all into one application. I’m going to try something new. This is the beginning of an attempt at an unquantized set…
When a group of points is moving towards a higher iteration level, their escape point is only slowly dropping towards the origin. When they finally drop below escape radius, and the equation must be iterated one more time, the new escape point is pretty far away – and the set is quantized no matter what math you use on the escape point.
So I’m going to measure the real point of escape: where the last line segment formed by the last two points crosses the escape circle.
Here’s my implementation of the quadratic formula:
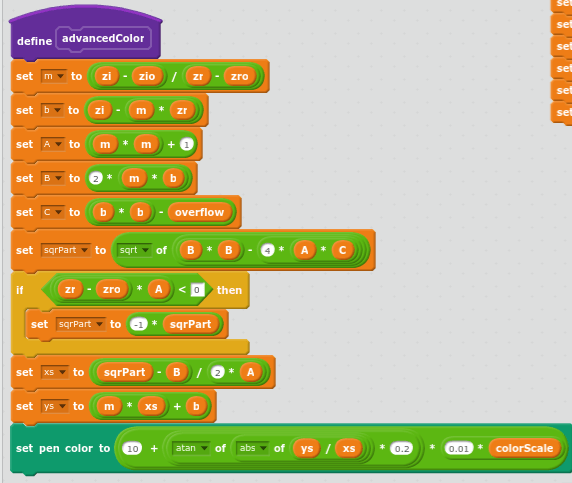
Where zr is the real component of the escape point, zi is the imaginary component, and zro and zio are the previous point.
Where m is the slope of the escape line segment, and b is the y intercept of the escape line segment, and A, B, and C are the three coefficients of the quadratic formula.
A more detailed explanation of the math is embedded in the project.
https://scratch.mit.edu/projects/128071393/
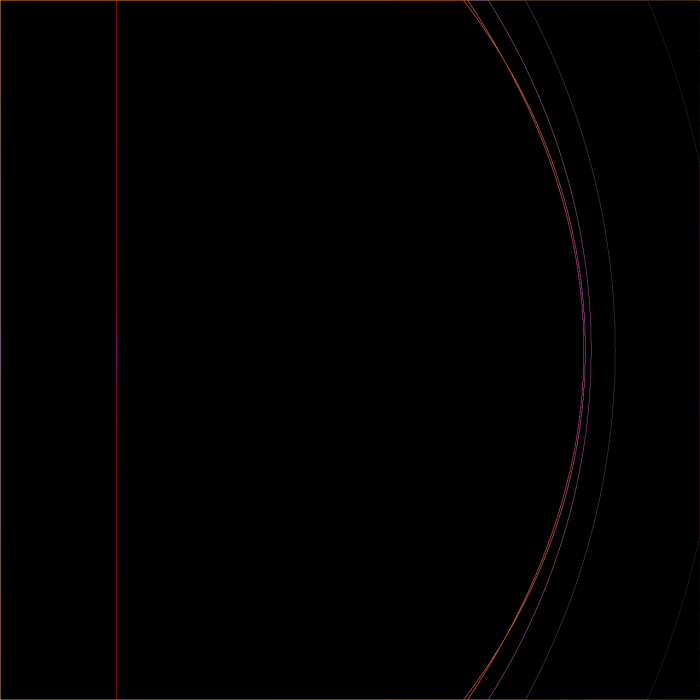
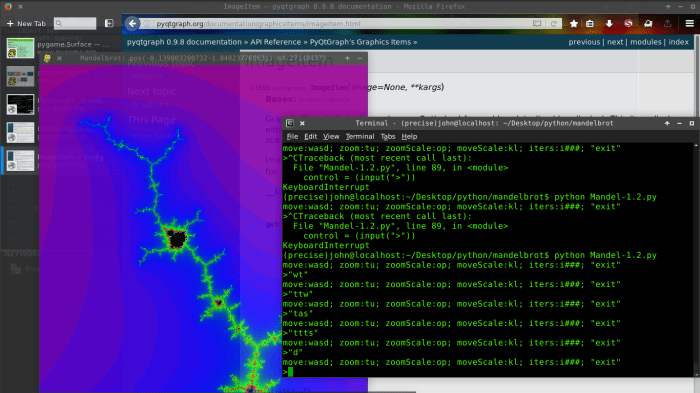
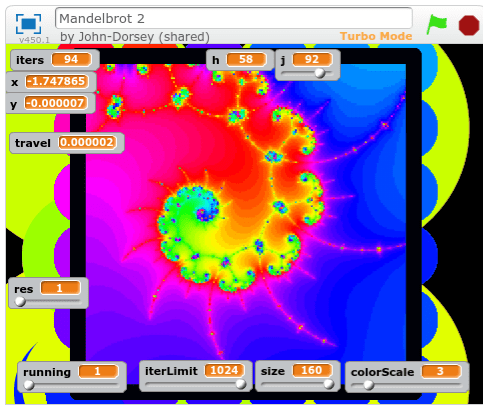
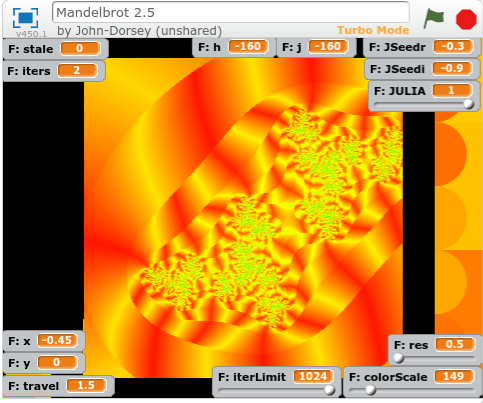
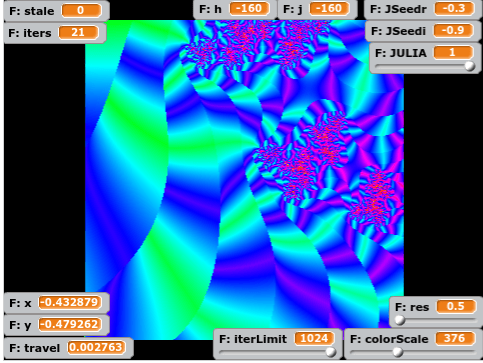
Before I started testing this math, I made a few tweaks to allow the generation other Julia sets. So here’s a Julia Set from the seed -0.3-0.9i
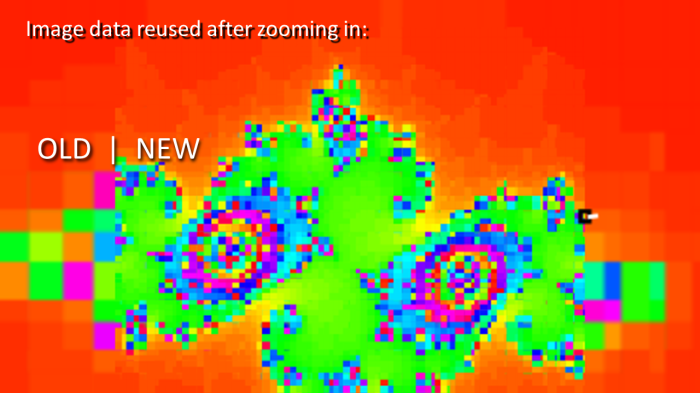
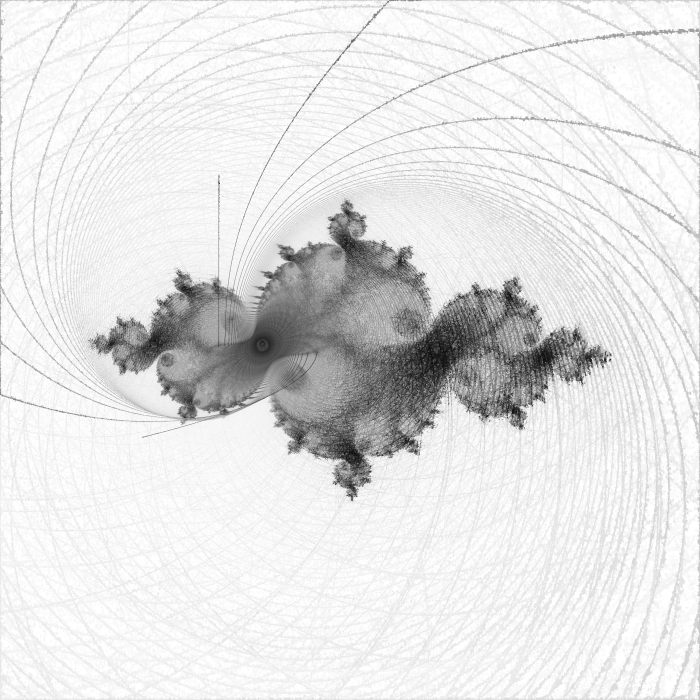
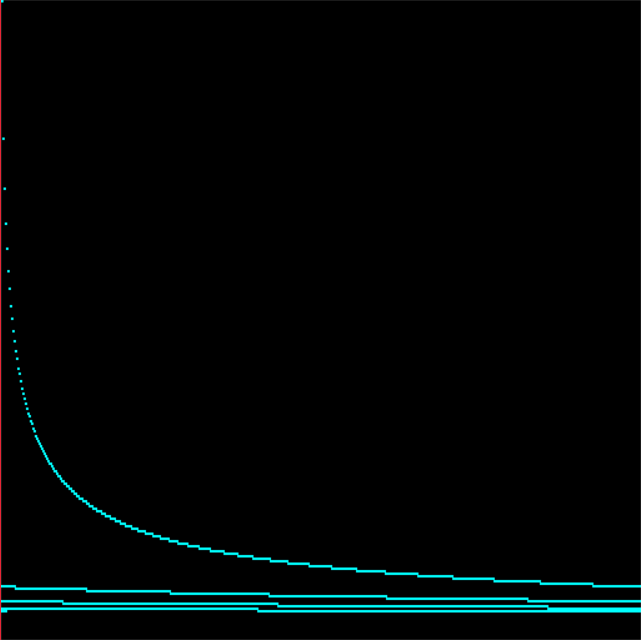
I went from this:

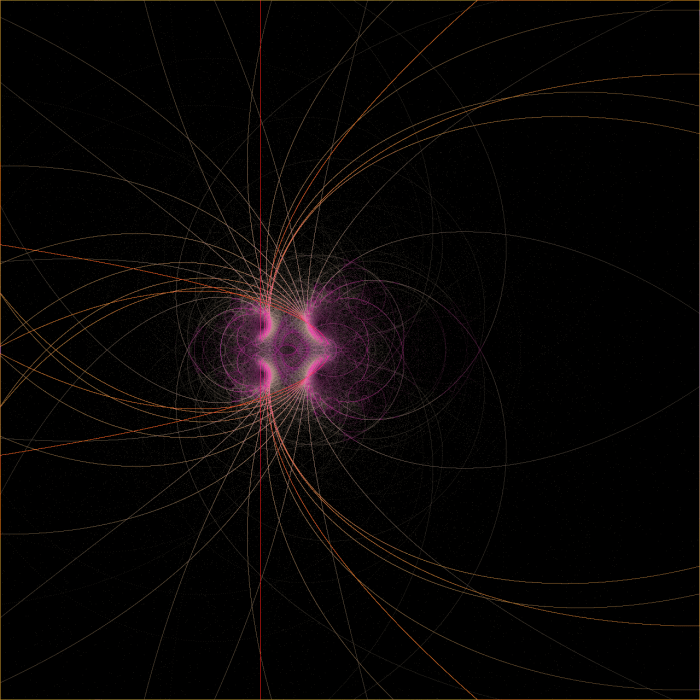
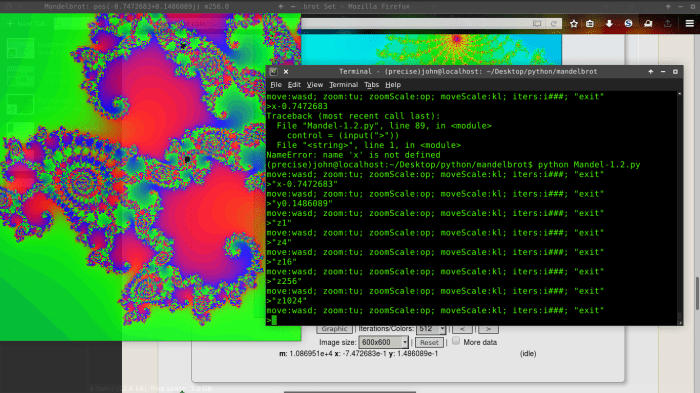
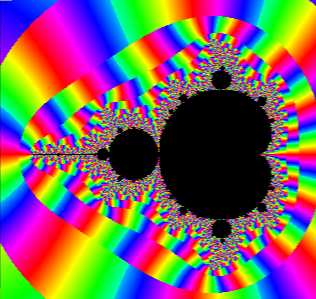
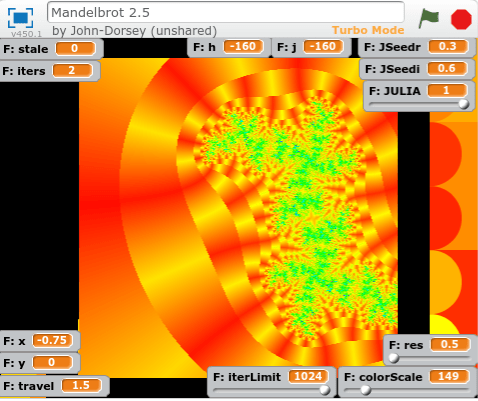
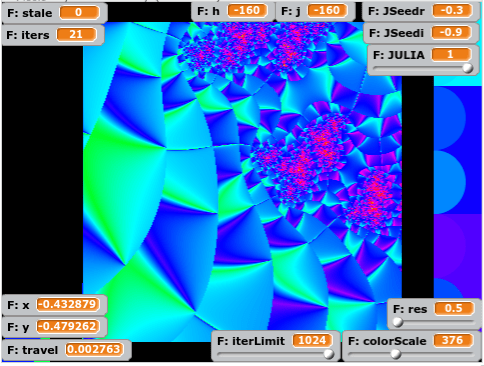
to this:
The yellow strips, corresponding to higher angles relative to the origin, now tilt towards the nearest tips of the prominent features of high iteration count.
I would characterize good outcoloring as that which helps you identify features you would have otherwise missed. So I can’t wait to test this algorithm in a compiled language.

It really reminds me of a block of ray-traced ripply glass inside a red and yellow world.

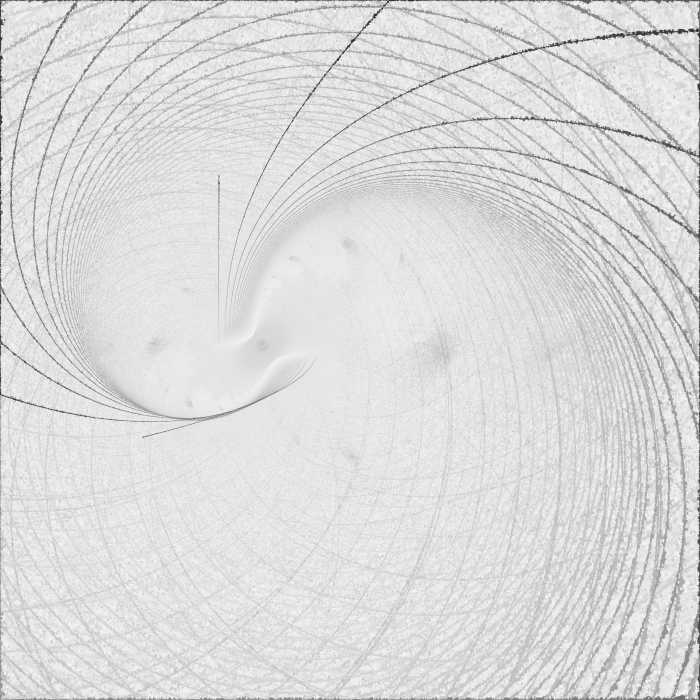
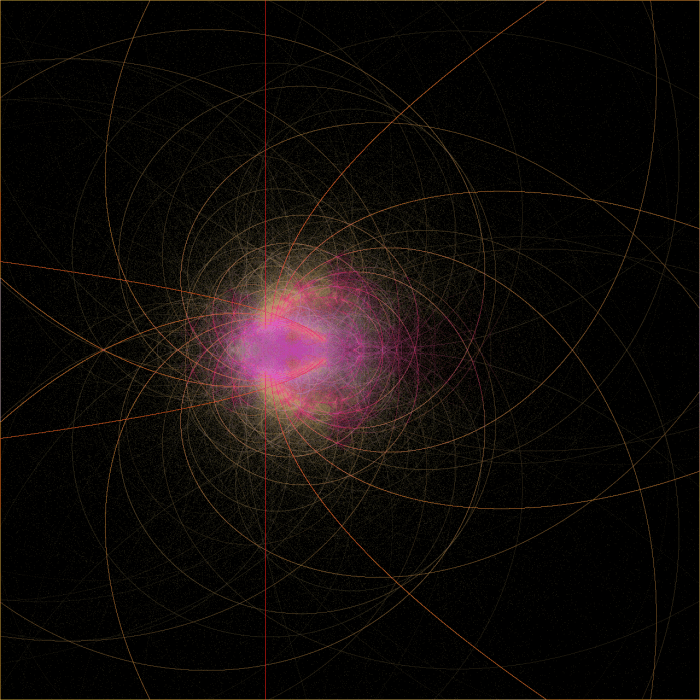
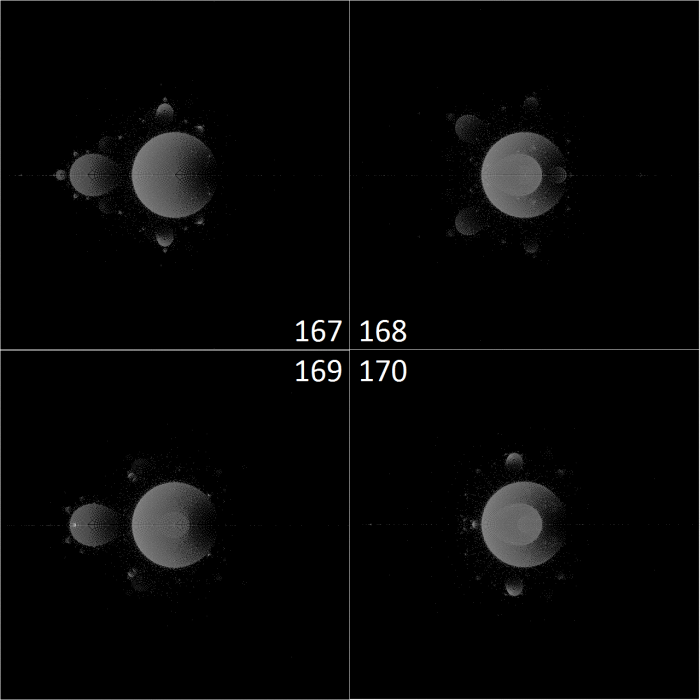
Now that I have two new outcoloring modes, I’ll divide one by the other just for giggles:
Obviously, none of these are images of a truly unquantized set. This is because a point from an area which almost escapes will still travel quite a distance upon their next iteration. And, rather than gracefully leave the escape radius at a point not far along the next line segment (as they would if the next line segment had nearly the same slope), they fall back away from the escape circle at an acute angle – actually dropping in absolute value before they escape a couple radians away.
I have a few more ideas.
I’m also taking major steps in the direction of using clones for a multithreaded approach, as well as rendering a simple Julia set based on the context of the Mandelbrot set.
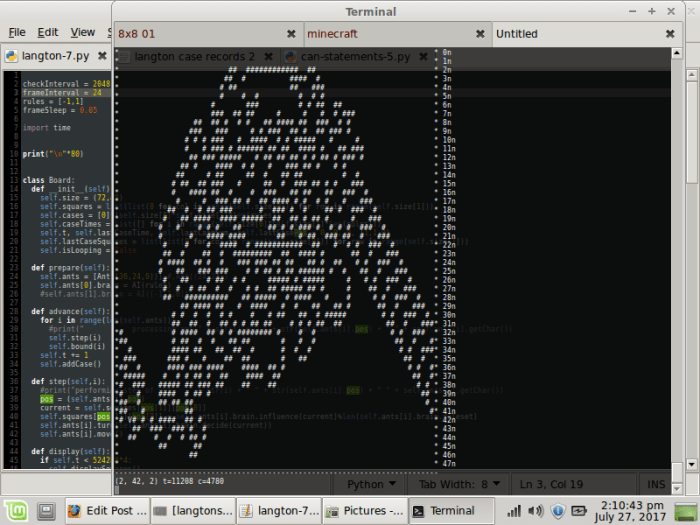
You can view all of my code here