In my earlier experiments, I placed the starting points of a Buddhabrot generator along a line through the Mandelbrot set. The points starting below the real axis produced a mirror image of those that started above, and a lot of detail was wiped out when the two images were blended. From now on, any vertical lines will be cut off at the real axis, and the asymmetry will be visible.
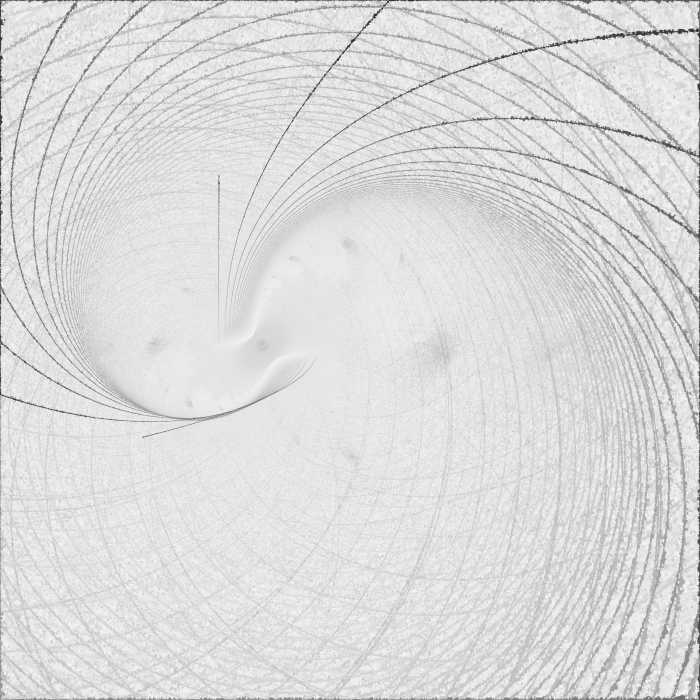
Here’s the non-mirrored Buddhabrot of seahorse valley:
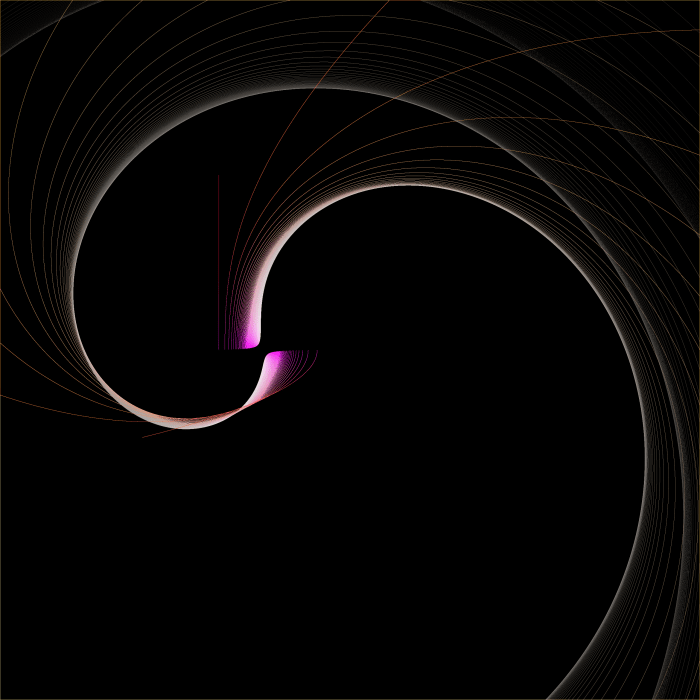
(This is the same coloration method as was outlined in Vertical slices of the Buddhabrot)
When moved slightly to the right, the line of starting points begins to cut into the seahorses and into the cardioid itself. The Buddhabrot then forms the image of a seahorse Julia set.

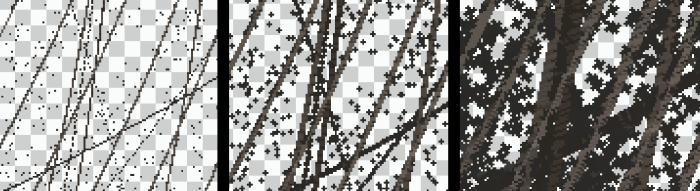
Most pixels in the image are pure black, so I wanted to interpolate all color data from the non-black pixels before starting to refine the image.
I will eventually automate this, because I know I’ll want to do it again. But for now, I’m working with Photoshop. I deleted all black pixels, and tessellated the remaining pixels to fill the gaps. I did this by duplicating the layer 5 times, arranging the duplicates into a tiny pinwheel, merging them, and repeating.
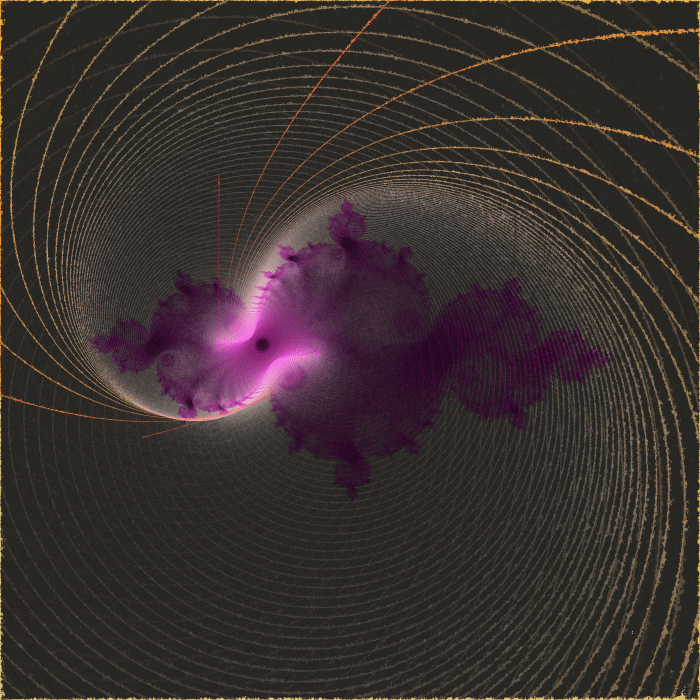
When the green channel is divided by the red channel, it yields the original measurements of progression of a point.
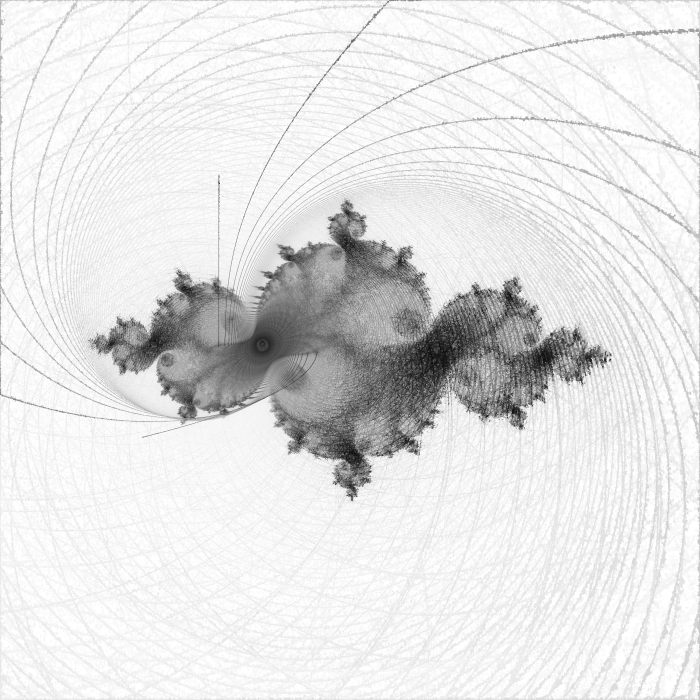
Perhaps the most interesting thing about this fractal is that it isn’t simply composed of points that started very near the real axis. The blue channel divided by red is not very distinct:
I’ll continue to work on explaining exactly how this type of fractal can be found, and also, how different it is from the basic seahorse Julia set.

