I’d like to share my progress on a new project. I’ve had a couple of breakthroughs, but I haven’t found the time to post them. I’ve created a Mandelbrot generator in python. It was based on the successful ASCII-output Mandelbrot generator, and it still uses a console window to receive input.
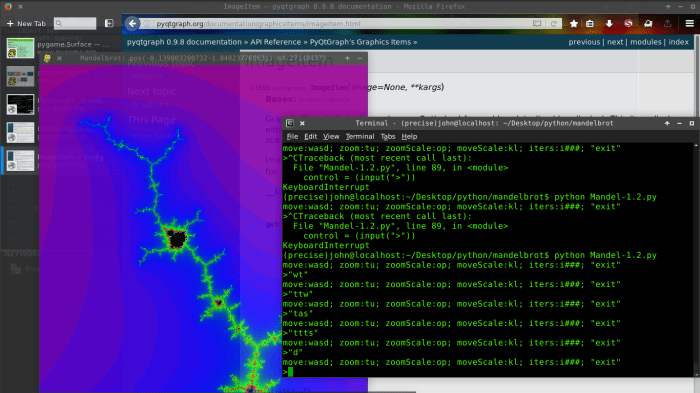
It started with the ancient tradition of using screen coordinates as color values because your code is producing a blank screen and you don’t know why.

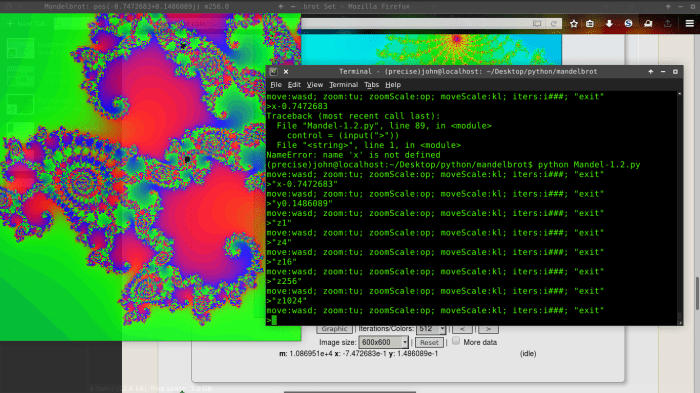
This was also a great way to test my color palette, which I eventually refined into a very simple Red->violet->Blue->Green sequence that I’ve never seen in another generator:
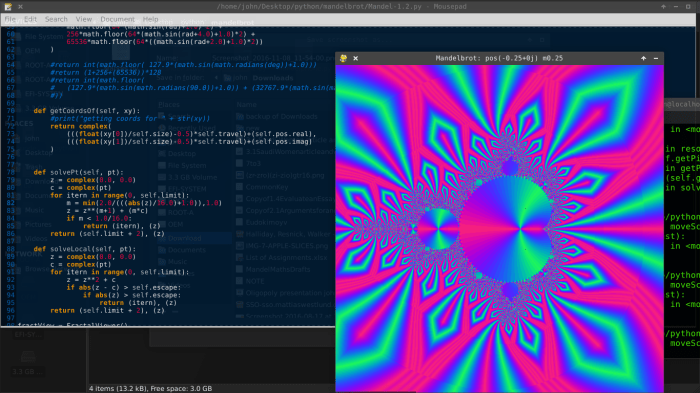
I’ve performed many experiments with this generator, which I hope to post someday. I’ve replaced the input handler with a loop that modifies certain parameters, and I’ve produced some attempts at a slowing expression that uses z -> z^(m+1) + (m*C) with m moving from 1 towards 0 as |z| increases. The point of that is to produce a final resting place of the process without using a simple escape threshold or limit. It cuts off when m drops below a certain value. Here’s what that looks like:
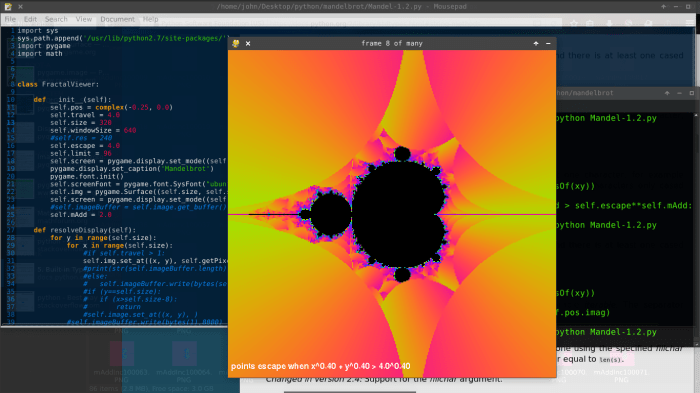
I’ve also created some sequences with varying escape threshold size and shape, to help demonstrate the areas that certain groups of points mostly live in. Here’s a frame from a sequence with an expanding threshold:
I’ll convert these PNG sequences to GIF’s and upload them here soon.
